Comprehensive dashboards with a holistic view
Nitor’s dedicated specialists have created intuitive dashboards especially for Department Heads to track their key KPIs. These dashboards showcase analytics by utilizing the most significant business data without hampering the current data management system. As a result, leaders can track KPIs of every single department of the organization to make strategic business decisions.
Meeting Management Dashboard
- Get a 360-degree view of your meetings, rooms, tasks, and other events with an intuitive dashboard
- Track end-to-end meeting lifecycle right from creation to comprehensive post-meeting insights
- With in-meeting analytics, real-time alerts, you have all the tools to ensure optimal meeting outcomes

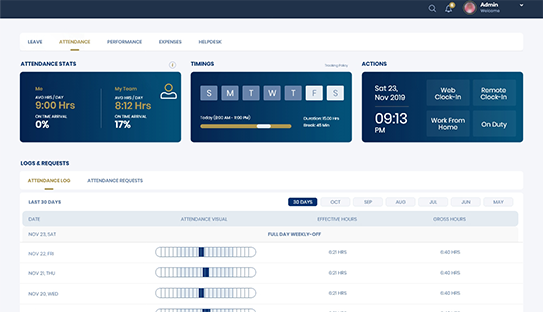
HR Dashboard
- Get a dashboard that showcases deep analytics as per the HR department requirement
- Achieve detailed insights of employee status like a new hire, employee termination, new workforce, etc.
- Track analytics of the IT operations based on available values of datasets
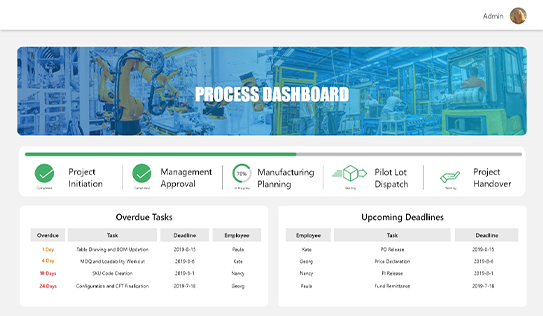
Manufacturing Process Dashboard
- Oversee machine usage, process efficiency, supply chain, etc. with a real-time data-driven view to adhere to manufacturing standards
- Monitor supply chain to identify problems before they reach critical levels
- Track downtime of the manufacturing plant production line, and keep an eye on planned and unplanned downtime trends
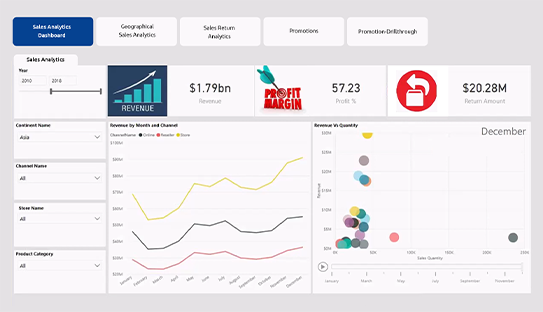
Sales Dashboard
- Assess KPIs with key metrics such as budgets, time estimates, confirmed orders, etc. from the factory floor to the sales team
- Provides intelligent upselling and cross-selling recommendations
- Insights on Order-in-hand, pending payments, last booked sales, price list update, etc to analyze overall sales performance


 +1 (224) 265-7110
 www.nitorinfotech.com